
Two of these five cars are hiding an accident
We ran 4,939 cars through our records while their buyers were still deciding. Two in every five came back with damage on file, the average one carries 8,040 euros of it, and most had been hit more than once.


Two in five is not a scare number. It is the rate we measured on cars people were about to pay for.
These are real used cars, caught in the middle of a purchase, checked by someone who wanted to be certain before they handed over the money. What came back is worth knowing before you are the one standing in that car park.
The short version
- 40.2% of the cars we checked had at least one accident or damage record on file.
- The average damaged car carries 8,040 EUR of assessed damage. One in five carries more than 10,000 EUR.
- 53.7% of damaged cars had been damaged more than once. Repeat damage is the normal case, not the rare one.
- Among the cars we could test, the damaged ones had their odometer wound back at twice the rate of the clean ones.
Skip ahead: check a car now·jump to the brand table
Two in every five had something on file
These were not random cars pulled out of a register. Every one of the 4,939 was a car somebody was about to buy, and asked us to check first.
40.2% came back with at least one recorded accident or damage claim. Two in every five. Not two in fifty.
Look at the five cars at the top of this page. The two with the crumpled panels are not the real risk, because nobody knowingly buys those. The risk is the same five cars photographed the way a seller actually photographs them, after the repairs are done and the paint is matched.
Nothing in a line up like that tells you which two they are. Not the paint, the panel gaps, the photographs or the seller. The only thing that separates them is what is written on file.

Make sure you are not buying one of the two
See a car's real mileage, damage, finance and country history across 30+ countries, in under a minute.
Example: WBA3A5G59DNP26082Free preview included
- 30+ countries
- Result in under a minute
- Full PDF report
It is not scratches
The natural assumption is that a damage record means something small. A car park scuff that someone claimed for, had painted, and forgot about.
It is not. The average damaged car in this data carries 8,040 EUR of assessed damage. That is the repair or settlement value an assessor put on the vehicle, not a number we estimated.
The spread matters more than the average, because the spread is where the risk actually sits.
| Total recorded damage on the car | Share of damaged cars |
|---|---|
| Under 500 EUR | 8.8% |
| 500 to 1,000 EUR | 11.0% |
| 1,000 to 2,500 EUR | 23.6% |
| 2,500 to 5,000 EUR | 19.4% |
| 5,000 to 10,000 EUR | 16.8% |
| 10,000 to 20,000 EUR | 11.7% |
| Over 20,000 EUR | 8.7% |
Based on 1,882 damaged cars where we hold a usable amount, adding together every damage record on the vehicle.
One in five damaged cars carries more than 10,000 EUR of assessed damage. One in twelve carries more than 20,000 EUR, which on a typical used car is more than the car itself is worth.
The tail runs further than that table shows. The most expensive one percent of individual damage records sit above 36,352 EUR, and the largest single record in this data is 112,377 EUR. One claim, on one car, now somewhere on the used market.
The middle of the pack sits at 3,177 EUR, well below the 8,040 EUR average. That gap is not noise, it is the shape of the problem. A small number of near total write offs pull the average up, and those cars are back on sale looking completely ordinary. The median tells you what a damaged car usually is. The average tells you what you are trying to avoid.
And it happened more than once
The next assumption to drop is that this was one bad afternoon years ago, properly repaired and behind the car for good.
Among cars with a damage record, 53.7% had been damaged more than once. Nearly one in five had four or more separate incidents on file. The average damaged car carries 2.4 records.
The bills rise with them:
| Damage records on the car | Median total damage |
|---|---|
| 1 record | 1,527 EUR |
| 2 records | 3,039 EUR |
| 3 records | 5,596 EUR |
| 4 records | 7,336 EUR |
| 5 or more records | 10,590 EUR |
At the far end, roughly one in seventy damaged cars carried more than ten separate damage records.
A car with a single repaired incident is the minority case.
Which badges carry the most
Sorted by how often a brand came back with something on file, the order is not the one most buyers would guess. Premium and sporting badges sit at the top next to value brands, while the names people buy for reliability sit lower down.
| Brand | Share damaged | Median total damage |
|---|---|---|
| Lexus | 55.6% | 6,626 EUR |
| Škoda | 53.2% | 3,429 EUR |
| BMW | 49.6% | 3,040 EUR |
| Mini | 48.0% | 4,281 EUR |
| SEAT | 46.9% | 3,642 EUR |
| Porsche | 45.8% | 5,776 EUR |
| Audi | 44.5% | 4,346 EUR |
| Volkswagen | 44.1% | 2,666 EUR |
Every brand shown was checked at least 40 times. Sorted by the share that came back with a damage record.
Two things are worth taking from this. The frequency: on several of these badges, close to half the cars checked had something on file. And the cost: Porsche and Lexus do not only come back damaged often, they come back expensive, at roughly twice the median bill of a Volkswagen.
Read it as a picture of what our customers bring us, which is mostly used imports, rather than a verdict on how well a car is built. A badge that gets bought in volume also gets checked in volume.
Where the car was hit, and what that tells you
The front of the car takes the largest share of impacts. It is also one of the cheaper places to be hit.
- Serious: structural or mechanical
- Moderate
- Usually cosmetic
| Area of the car | Share of records | Median cost |
|---|---|---|
| Front | 44.7% | 1,958 EUR |
| Rear | 30.9% | 1,535 EUR |
| Front right | 27.8% | 3,139 EUR |
| Front left | 26.3% | 3,082 EUR |
| Rear right | 21.7% | 2,331 EUR |
| Right side | 21.0% | 2,400 EUR |
| Rear left | 20.6% | 2,141 EUR |
| Left side | 19.5% | 2,447 EUR |
| Windscreen | 14.4% | 895 EUR |
| Interior | 6.0% | 12,006 EUR |
| Underbody | 5.4% | 9,844 EUR |
| Mechanical parts | 4.9% | 8,062 EUR |
| Roof | 4.1% | 4,107 EUR |
One record can list several areas, so the shares add up to more than 100 percent.
Look at the bottom of that table, not the top. Interior, underbody and mechanical damage are uncommon, but they cost four to six times what a knock to the front does.
That is not because a seat costs more than a bumper. Those areas only get listed when the crash was bad enough to reach the cabin, the floor or the drivetrain, and such a claim names several areas at once, so the figure shown is the whole claim. A windscreen sits at the bottom for the opposite reason: it is usually the only thing on the claim.
And where it happened
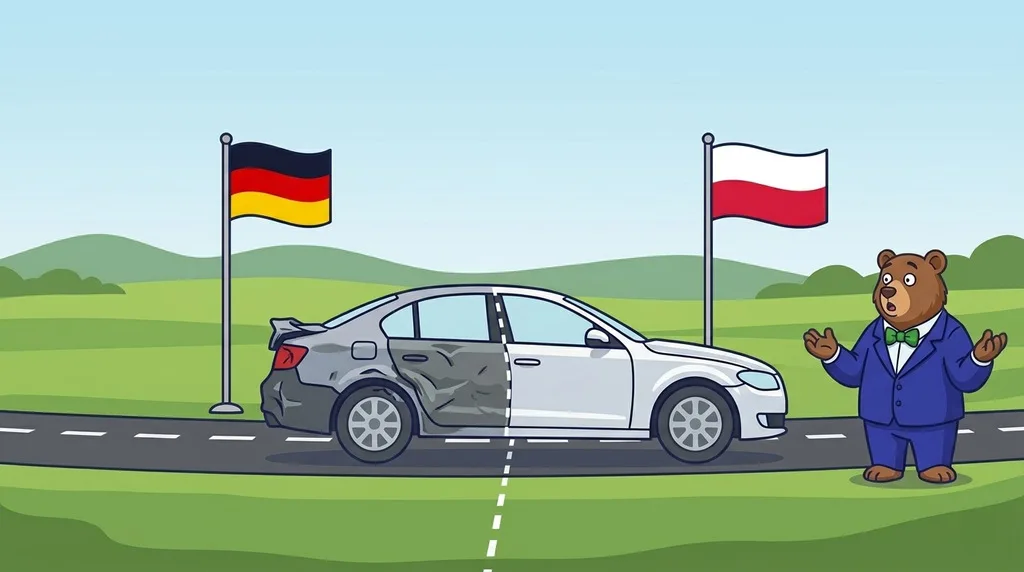
Most of these cars are imports, so the country a claim was filed in is usually the country the car lived in before it was sold on. That makes this a rough map of where a used import spent its working life.
| Country the damage was recorded in | Share of records | Median cost |
|---|---|---|
| Germany | 32.8% | 1,322 EUR |
| Poland | 17.3% | 1,316 EUR |
| Austria | 13.2% | 1,685 EUR |
| Romania | 8.0% | 790 EUR |
| Belgium | 5.0% | 1,551 EUR |
| France | 4.4% | 1,151 EUR |
| Switzerland | 2.5% | 2,706 EUR |
| Bulgaria | 2.3% | 298 EUR |
The eight countries with the most records. Smaller countries are left out because a handful of records cannot support a number.
Nearly two thirds of all recorded damage happened in Germany, Poland or Austria, which are also the three countries most of these cars were imported from. If you are buying a car that arrived from any of them, its history is more likely to exist than to be clean.
The odometer usually lies too
A rollback can only be spotted where we hold at least two odometer readings to compare, which is true of 2,673 of these cars. For the rest the honest answer is that we cannot tell, so they are left out completely rather than counted as clean.
Within the group we can test, the difference is stark. Cars with a damage record had been wound back 12.4% of the time. Cars with no damage record, 6.3%. Twice the rate.
The obvious objection is a fair one. Damaged cars tend to carry more odometer readings, because a claim usually records the mileage, and more readings mean more chances to catch a rollback. So is this simply an effect of seeing damaged cars more clearly?
No. Splitting both groups by how much history we hold answers that directly:
The gap holds at every level, from the thinnest histories to the richest. The mechanism is not complicated. Someone who has decided to hide a crash has already made the hard decision, and the odometer is that same decision applied to a second number.
Put both problems on the same car and 6.5% of everything we could test carried a damage record and a wound back odometer together. About one car in fifteen was hiding two things at once.
It is not simply that the car was damaged. It is that someone hid the damage, and was willing to hide the mileage as well.
New does not mean clean
Damage builds up over time, so older cars carry more of it. That much is obvious. What is less obvious is how early it starts, and how quickly a car stops being the safe bet its age suggests.
| Model year | Share with damage on file | Median total damage |
|---|---|---|
| 2022 and newer | 25.9% | 3,609 EUR |
| 2018 to 2021 | 43.1% | 3,829 EUR |
| 2014 to 2017 | 51.3% | 3,346 EUR |
| 2010 to 2013 | 50.8% | 2,675 EUR |
| 2005 to 2009 | 52.6% | 2,735 EUR |
Cars built before 2005 are deliberately left out. Claims records thin out the further back you go, so the apparent drop among the oldest cars is our visibility, not their history.
A car from the last three or four years is still roughly a one in four proposition. By the middle of the last decade it is a coin flip, and it stays there. The steep climb happens early, between a nearly new car and one that is merely a few years old, rather than somewhere late in its life.
Now read the last column. The two newest groups are damaged least often, yet they carry the highest median repair bills of any group, around a third more than cars built between 2005 and 2009. Newer cars cost more to put right, so a nearly new car with one accident on file can easily carry more damage value than an older car with two.
The second way to look at this is not how old the car is now, but how old it was when the damage happened:
| Age of the car at the time of the accident | Share of damage records |
|---|---|
| Under 3 years old | 33.7% |
| 3 to 5 years old | 31.7% |
| 6 to 10 years old | 24.9% |
| 11 to 15 years old | 7.2% |
| Over 15 years old | 2.6% |
Based on damage records where both the accident date and the car's first registration are known. The median damaged car was four years old when it happened.
Two thirds of all the damage in this data happened before the car turned six. A third of it happened before the car turned three, while it was still under warranty and still being described as nearly new.
That is the part worth taking to a viewing. The damage is not waiting at the far end of a car's life for somebody else to deal with. It happens early, to cars that still look and sell like young ones, and it is on file long before the paint gives anything away. A recent registration is not a clean history. It is a shorter one.
A clean report means no damage was recorded. Damage that was never claimed leaves nothing behind to find, so no check can promise a perfect car. What it can do is tell you which of the five you are looking at.
Before you sign anything
Know which one you are buying
Mileage, damage, finance and import records across 30+ countries, in one report, in under a minute.
- 30+ countries
- Under a minute
- Full PDF report
Not sure yet? See what a full report looks like first
Frequently asked questions
What share of used cars have accident damage on file?
Among the 4,939 cars our customers asked us to check, 40.2 percent had at least one recorded accident or damage claim. That measures cars in the middle of being bought and sold, which are checked precisely because somebody wanted certainty, so it is not a figure for every car on the road.
How much damage does a damaged used car normally carry?
The median damaged car carries 3,177 euros of assessed damage and the average is 8,040 euros. The gap between the two is a small number of near total write offs pulling the average up. One in five damaged cars carries more than 10,000 euros, and one in twelve more than 20,000.
Does a clean history report mean the car was never damaged?
No. It means no damage was recorded. Damage that was never claimed, never insured or never reported leaves nothing behind to find. A clean report is a strong signal, not a guarantee, and any service that tells you otherwise is overselling.
Is a repaired car always a bad buy?
No. A repaired front bumper on an otherwise good car is a bargaining point, not a reason to walk away. What matters is where the car was hit and how much the claim was worth. A history that names the interior, the underbody or the mechanical parts points to a crash that reached the structure of the car, and those are the ones to be careful with.
Are damaged cars more likely to have a wound back odometer?
Yes, about twice as likely. Among the cars where we hold enough odometer history to test, 12.4 percent of the cars with a damage record had been wound back, against 6.3 percent of those without one. The gap holds at every level of history we hold, so it is not simply an effect of seeing damaged cars more clearly.
How can I check whether a used car has been in an accident?
Run its VIN, or its number plate where that is supported, through a history check. A report reads recorded damage and claims, mileage readings and rollbacks, finance and theft flags, and the countries the car has been registered in, across more than 30 countries. It takes under a minute, and it is the only part of a viewing that a fresh coat of paint cannot change.
Where do these numbers come from?
From our own checks. We took 4,939 vehicles that MrVIN customers submitted for a history check and looked at what the damage and claim records held against them actually said. Every figure names the group it is based on, and cars we could not assess are left out rather than counted as clean.
About this data
- What was analysed: 4,939 vehicles submitted for a history check by MrVIN customers, run against the damage and insurance claim records we hold. These cars are self selected, meaning somebody chose to check them, which is why the figures here run higher than a whole market average would.
- Damage figures: 1,985 cars with at least one damage record. Cost figures use the assessed repair or settlement value recorded against each incident, across 4,418 individual records with a usable amount on 1,882 cars. Records that could not be placed in euros are left out of every money figure.
- Rollback figures: restricted to the 2,673 cars where we hold at least two odometer readings, since a rollback can only be found by comparing readings. The remaining cars are excluded rather than counted as clean.
- Damaged area figures: 2,871 records that identify an area. One record can name several areas, so the shares total more than 100 percent, and the cost shown against an area is the value of the whole claim rather than that one part.
- Brand figures: limited to brands checked at least 40 times. The mix reflects what our customers bring us, largely used imports, and is not a sample of the wider car park.
- Averages and medians: where a distribution has a long tail we give the median as well, because a handful of write offs move an average a long way. Both are stated wherever both matter.
Read next